
Marketing has never been short on activity. There are posts to publish, emails to send, campaigns to launch, website updates to make, and dashboards full of numbers waiting for attention.
The dynamic shift is that activity alone no longer tells you whether your marketing is working. A busy marketing calendar can still produce an empty sales pipeline.
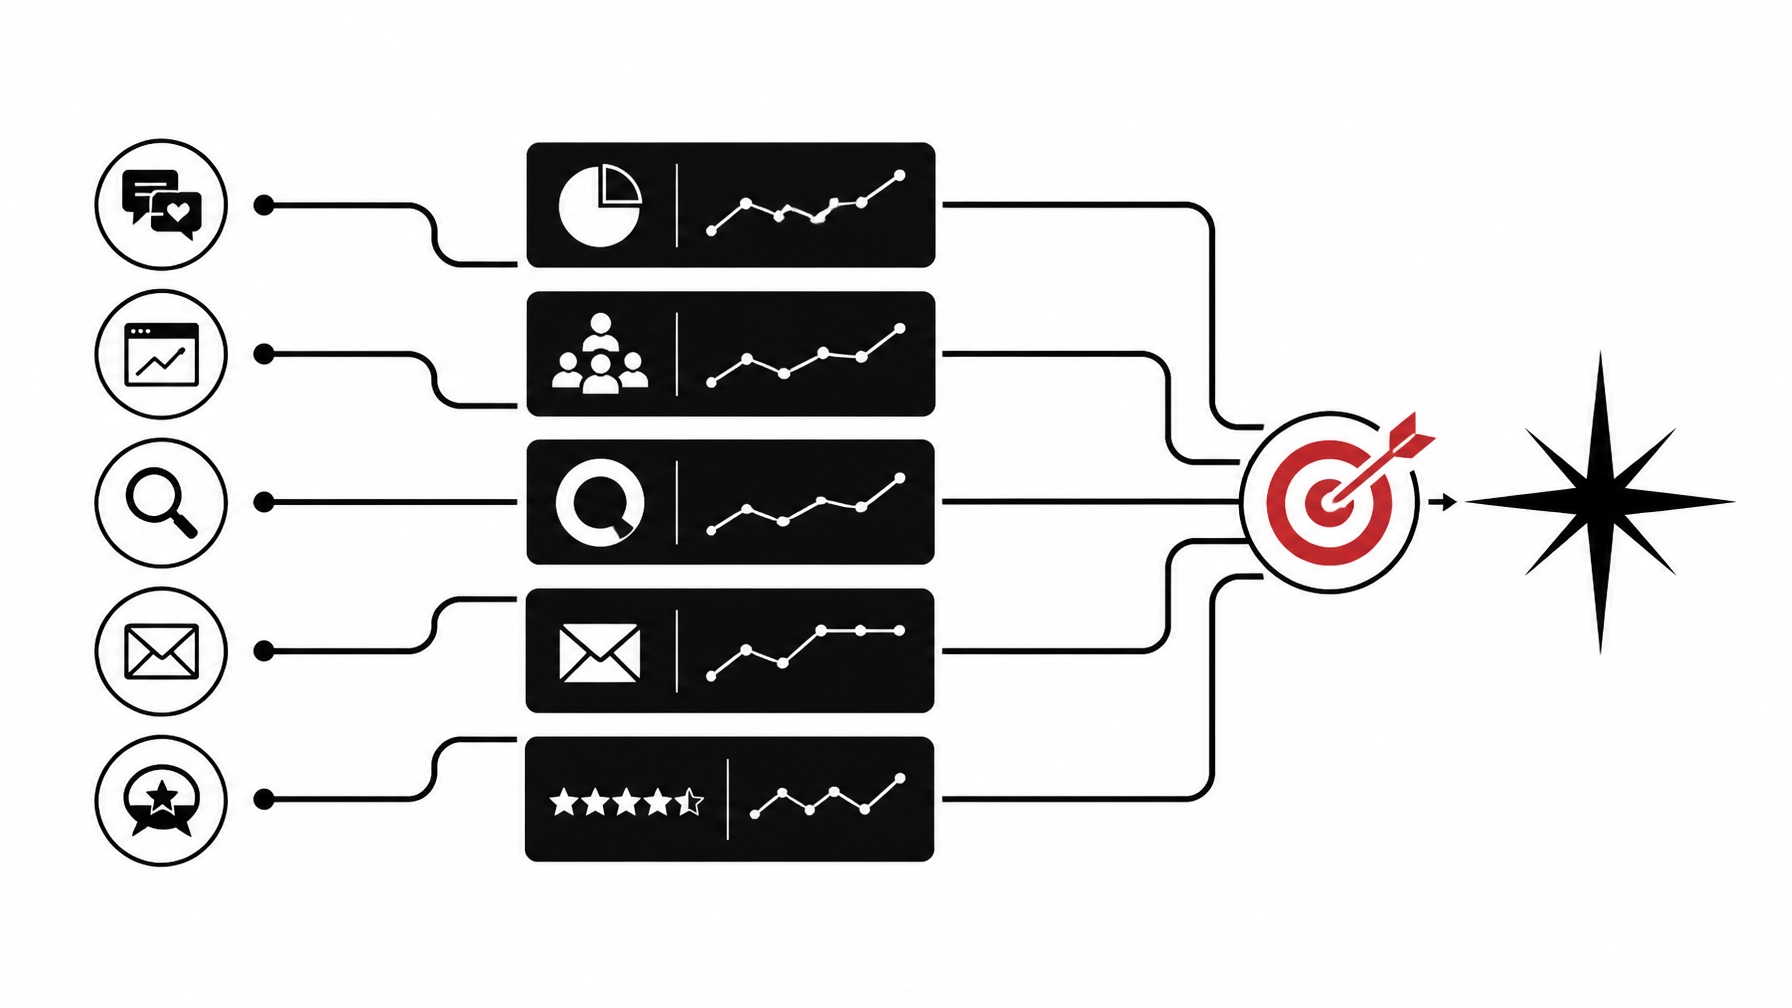
That is where a marketing scorecard helps. It connects what you do: such as publishing content, running ads, improving SEO, or collecting reviews: to what the business actually needs: qualified leads, new customers, revenue, and better decisions.
This is Week 2 of our five-part Marketing Clarity & Strategic Performance Series. In Week 1, we focused on replacing assumptions with clarity. Now, you’ll learn how to turn that clarity into a simple measurement system.
Activity Is Not the Same as Performance
Most businesses track marketing activity because it is easy to see:
- Number of social media posts
- Impressions and reach
- Website visits
- Email opens
- Clicks
- Ad views
- Blog articles published
These numbers are not useless. They can help you understand awareness and engagement. However, they are only the beginning of the story.
The more important questions are further down the line:
- How many qualified leads did marketing generate?
- Which channels produced actual sales conversations?
- How much did it cost to acquire each customer?
- Which campaigns influenced revenue?
- Are customers finding you through your website, search, social media, referrals, reviews, or AI-generated search results?
- What should you continue, improve, pause, or stop?
A marketing scorecard brings both sides together. It gives you enough information to make a decision without turning your Monday morning into an accidental data conference.

What a Marketing Scorecard Should Do
A useful scorecard should answer one practical question:
Is our marketing investment creating meaningful business impact: and what should we do next?
To answer that, organize your scorecard around four levels:
- Activity: What did you do?
- Response: How did people interact?
- Business outcome: Did those interactions create qualified opportunities or customers?
- Decision: What action should you take based on the result?
The goal is not to track every possible marketing metric. A focused scorecard usually works better with 8–12 metrics than with 50 numbers no one reviews.
Start With Your Business Goal
Before choosing metrics, define the business result your marketing needs to support.
For example:
- A local service business may need 20 qualified inquiries per month.
- An online retailer may need to increase repeat purchases by 15%.
- A professional services firm may need five sales-ready consultations each month.
- A growing company may need to reduce its cost per customer from $600 to $450.
- A new business may need to establish baseline performance before increasing its budget.
Your scorecard should reflect the goal: not simply the platforms you happen to use.
If your goal is revenue growth, “we published 12 posts” is context. It is not the result.
The Core Metrics to Include
Here is a simple starting point. You can adapt it based on your business model and sales cycle.
| Scorecard metric | What it tells you | Simple formula or source |
|---|---|---|
| Marketing spend | What you invested by channel | Ad platforms, invoices, software costs |
| Website conversion rate | Whether visitors take the next step | Leads ÷ website visitors |
| Qualified leads | Whether marketing is attracting the right prospects | CRM or lead tracking |
| Cost per lead | Efficiency of lead generation | Marketing spend ÷ total leads |
| Sales opportunities | Whether leads are progressing | CRM or sales records |
| New customers | How many leads became customers | CRM or accounting system |
| Cost per customer | What it costs to acquire a customer | Marketing spend ÷ new customers |
| Revenue from marketing | The business value generated | CRM, ecommerce, or accounting data |
| Marketing ROI | Whether the investment produced financial return | (Revenue − marketing cost) ÷ marketing cost |
| AI visibility | Whether your business appears in relevant AI search experiences | Prompt testing, referral data, visibility tracking |
You do not need perfect attribution to begin. You need consistent definitions.
For example, decide what counts as a qualified lead. It might be a prospect in your service area with a real need, a realistic budget, and a requested next step. A newsletter signup may be valuable: but it is not automatically sales-ready.
A Worked Example: From Clicks to Customers
Let’s look at a fictional small business: a commercial cleaning company serving a defined local market.
During one month, the company invests:
- $1,500 in Google Ads
- $500 in local SEO and content support
- $300 in email and CRM tools
- $200 in social media promotion
Total marketing investment: $2,500
The activity looks healthy:
- 18,000 ad impressions
- 2,400 website visits
- 85 form submissions
- 30 phone calls
- 115 total leads
But the scorecard goes further:
- 42 leads were qualified
- 18 became sales opportunities
- 6 became new customers
- New customer revenue was $12,000
Now the business can calculate:
- Cost per lead: $2,500 ÷ 115 = $21.74
- Cost per qualified lead: $2,500 ÷ 42 = $59.52
- Cost per customer: $2,500 ÷ 6 = $416.67
- Marketing ROI: ($12,000 − $2,500) ÷ $2,500 = 380%
That is a much more useful story than “our ads received 2,400 clicks.”
The business can also compare channels. Perhaps Google Ads generated 70 leads but only two customers, while SEO and referrals generated 25 leads and four customers. Google may be better at creating volume, while SEO and referrals may be producing higher-quality opportunities.
The decision is not automatically to shut off Google Ads. The better decision may be to improve targeting, landing page messaging, qualification questions, or follow-up speed.
That is the difference between collecting data and using it.
Important: This example is illustrative. Your results will depend on your industry, sales process, customer value, budget, and measurement quality.

Connect the Entire Marketing System
Revenue rarely comes from one isolated channel. Your website, SEO, social media, content, email, reviews, sales process, and customer experience work together.
A prospect might:
- See a social media post.
- Search for your business later.
- Read a blog article.
- Review your testimonials.
- Visit your website.
- Ask an AI search tool for recommendations.
- Submit a form or call your team.
If you only credit the final form submission, you may miss the influence of the earlier touchpoints. If you credit every interaction equally, you may overstate the value of channels that create attention but not action.
Your scorecard should therefore include both:
- Channel-level metrics, such as leads and cost per customer
- Customer journey context, such as assisted conversions, returning visitors, branded searches, reviews, and sales feedback
AI visibility belongs in this integrated view. Track whether your company appears when prospects ask relevant AI tools for recommendations, comparisons, or providers. Also review whether your website content, service descriptions, reviews, and business information give those systems enough clarity to understand and represent your company accurately.
AI visibility is not a replacement for SEO. It is another part of modern marketing performance.
Three Small-Business Scenarios
Scenario 1: The owner doing everything
You run a small home services company. You post regularly, receive likes, and occasionally get website traffic: but you do not know which activity creates calls.
Start with a simple monthly scorecard:
- Website inquiries
- Phone calls
- Qualified leads
- New customers
- Revenue
- Marketing spend
- Cost per customer
You do not need a complex dashboard. A well-maintained spreadsheet is enough to establish a baseline.
Scenario 2: The team with plenty of activity
You have a marketing coordinator who manages email, social media, and content. Every channel is active, but sales says the leads are inconsistent.
Add quality and progression metrics:
- Qualified lead rate
- Lead-to-opportunity rate
- Opportunity-to-customer rate
- Revenue by source
- Sales response time
This helps you see whether the issue is messaging, targeting, follow-up, or the sales process itself.
Scenario 3: The growing company increasing its budget
You are preparing to invest more in paid media, content, or a new campaign. Before spending more, establish:
- Current cost per qualified lead
- Current cost per customer
- Average customer value
- Conversion rate by channel
- Revenue generated over a defined period
Then set a specific target. For example: “Increase qualified leads by 25% while keeping cost per customer below $500.”
This gives your strategic marketing plan a measurable operating target: not just a list of campaigns.
Build Your Scorecard in One Afternoon
You can create a practical first version in Google Sheets or Excel.
Step 1: Choose one reporting period
Start monthly if your sales cycle is longer. Use weekly reporting only when you have enough activity to identify meaningful patterns.
Step 2: List your active channels
Include the channels you actually use:
- Website
- Organic search
- Paid search
- Social media
- Content
- Reviews and referrals
- AI search visibility
Step 3: Define each metric
Write down what each number means and where it comes from. This prevents “lead” from meaning one thing to marketing and another thing to sales.
Step 4: Add targets
Targets can be based on past performance, revenue goals, capacity, or a test period. A target does not need to be perfect: it needs to create a useful point of comparison.
Step 5: Add an action column
For every metric that is below target, record:
- What happened?
- Why might it have happened?
- What will we change?
- Who owns the next step?
- When will we review it?
Without an action column, your scorecard is just a well-dressed report.
Quick Self-Check: Which Stage Are You In?
Choose the statement that sounds most like your business.
Tier 1: Activity Tracking
You mainly track posts, impressions, opens, clicks, and website visits.
Your next step: Add qualified leads, customers, revenue, and marketing spend. Start connecting activity to outcomes.
Tier 2: Performance Tracking
You track leads and customers, but your data is spread across different platforms: or sales and marketing use different definitions.
Your next step: Create a shared metric dictionary and connect your CRM, website, advertising, and accounting information.
Tier 3: Decision-Ready Measurement
You know which channels influence revenue, understand cost per customer, and regularly adjust your investment.
Your next step: Improve forecasting, test customer segments, evaluate AI visibility, and align your scorecard with your broader strategic marketing plan.
If you are between tiers, that is normal. Most businesses build measurement gradually.
When You Need Outside Perspective
A scorecard tells you what is happening. It does not always explain why.
That is where marketing performance consulting can help: especially when:
- Your numbers conflict across platforms.
- You have leads but not enough sales.
- Your marketing team is busy but priorities are unclear.
- You are considering a larger investment.
- You need a marketing ROI analysis before changing your budget.
- Your website, content, SEO, reviews, and social presence do not communicate one clear message.
- You want to understand your visibility in AI-generated search results.
A marketing effectiveness audit can help you identify gaps, clarify definitions, and prioritize the actions most likely to improve performance. For businesses developing a practical marketing strategy for small business growth, that outside perspective can prevent months of effort in the wrong direction.
Clarity Before More Spend
A marketing scorecard is not designed to make your business chase numbers. It is designed to help you make better decisions.
The best scorecard gives you confidence to:
- Invest more in what is working
- Fix what is underperforming
- Stop activities that create noise without meaningful impact
- Improve message clarity and customer trust
- Align marketing with sales and revenue goals
- Explain marketing performance to leadership
You do not need more activity simply because your competitors are active. You need to understand which actions create the strongest path to revenue.
If you would like help building that path, book a discovery meeting with Flint Avenue. We can help you evaluate your current measurement system, identify the gaps, and determine whether a focused Spark Strategy Session or consulting package is the right next step.
Coming in Week 3: We’ll move from measurement to prioritization: how to decide which marketing opportunities deserve your time, budget, and leadership attention first.